
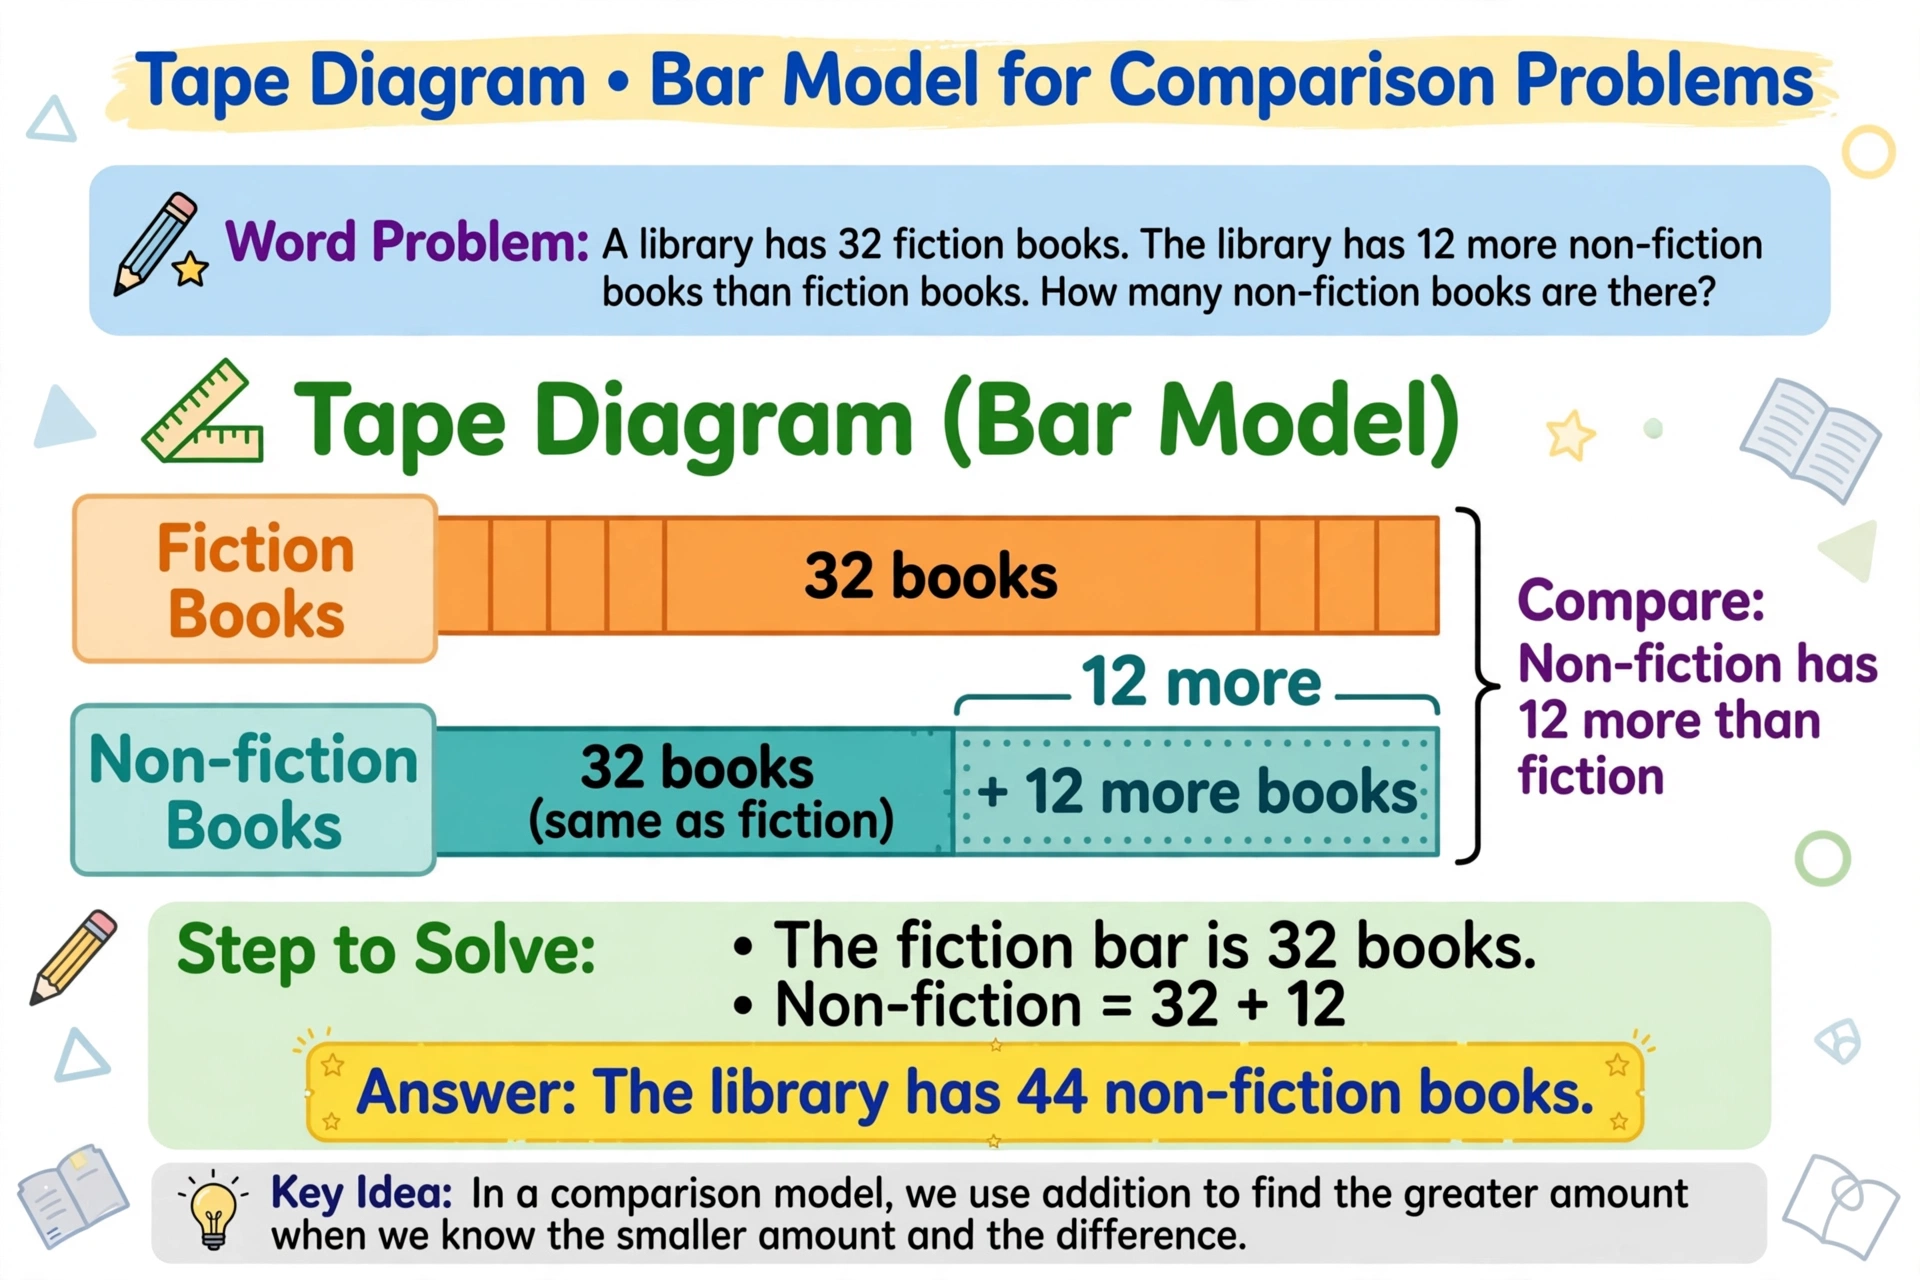
Maya has 24 stickers. She gives 9 away. How many left? Draw a long bar for 24. Mark off 9. The remaining piece is the answer. That drawing is a tape diagram, and it turns confusing words into clear pictures.
What Is a Tape Diagram?
A tape diagram (also called a bar model) is a rectangular bar representing a quantity, divided to show parts and wholes. For addition, one bar shows the total with parts marked. For comparison, two bars show the relationship. The visual makes the math structure visible.
Tape diagrams originated in Singapore math and spread because they work. They help students see what is happening before calculating, which prevents the “grab numbers and guess” approach.
Why Are Tape Diagrams Effective?
They force comprehension. You cannot draw the diagram without understanding the story. A student who draws correctly has already solved half the problem. The drawing is the thinking made visible.
They work for all operations. Part-whole for addition/subtraction. Comparison for “more than/less than.” Multiplication as equal groups. Division as sharing. One tool, many uses. Students learn a single visual language for diverse problems.
How Do You Teach Them?
Start with concrete stories. “I have 5 apples. You have 3. How many together?” Draw one bar for 5, one for 3, combine. The simple case builds the habit.
Teach the question: “What is happening?” Before drawing, students retell the story. Then: “What will the bars show?” The planning prevents random drawing.
Progress to comparison. “Tom has 15, which is 6 more than Sara.” Draw Tom’s longer bar, Sara’s shorter, mark the difference. Comparison bars are powerful but need explicit teaching.
Try It: Draw Tape Diagrams
Step 1: Read: “A store has 48 pencils. It sells 27. How many left?”
Step 2: Draw a bar labeled 48. Mark off 27. Label the rest “?”.
Step 3: Solve: 48 – 27 = 21. The diagram shows subtraction.
Step 4: Try a comparison: “Lena has 32 books, 8 more than Max.” Draw both bars.
Quick Practice
Question: Draw a tape diagram for: “There are 56 students. 29 are girls. How many are boys?”
Answer: One bar labeled 56 (total). Mark a section for 29 girls. The remaining section is boys: 56 – 29 = 27.
Frequently Asked Questions
Are tape diagrams the same as bar models?
Yes, different names for the same tool. “Tape diagram” is common in US curricula. “Bar model” is the Singapore term. Use whichever your curriculum uses.
When should students stop drawing them?
When they can visualize mentally. Many students internalize by 5th grade. But keep them available; even adults sketch for hard problems.
Do tape diagrams work for fractions?
Beautifully. Draw a bar for 1 whole, partition into fourths, shade 3/4. The visual makes fraction operations intuitive.