
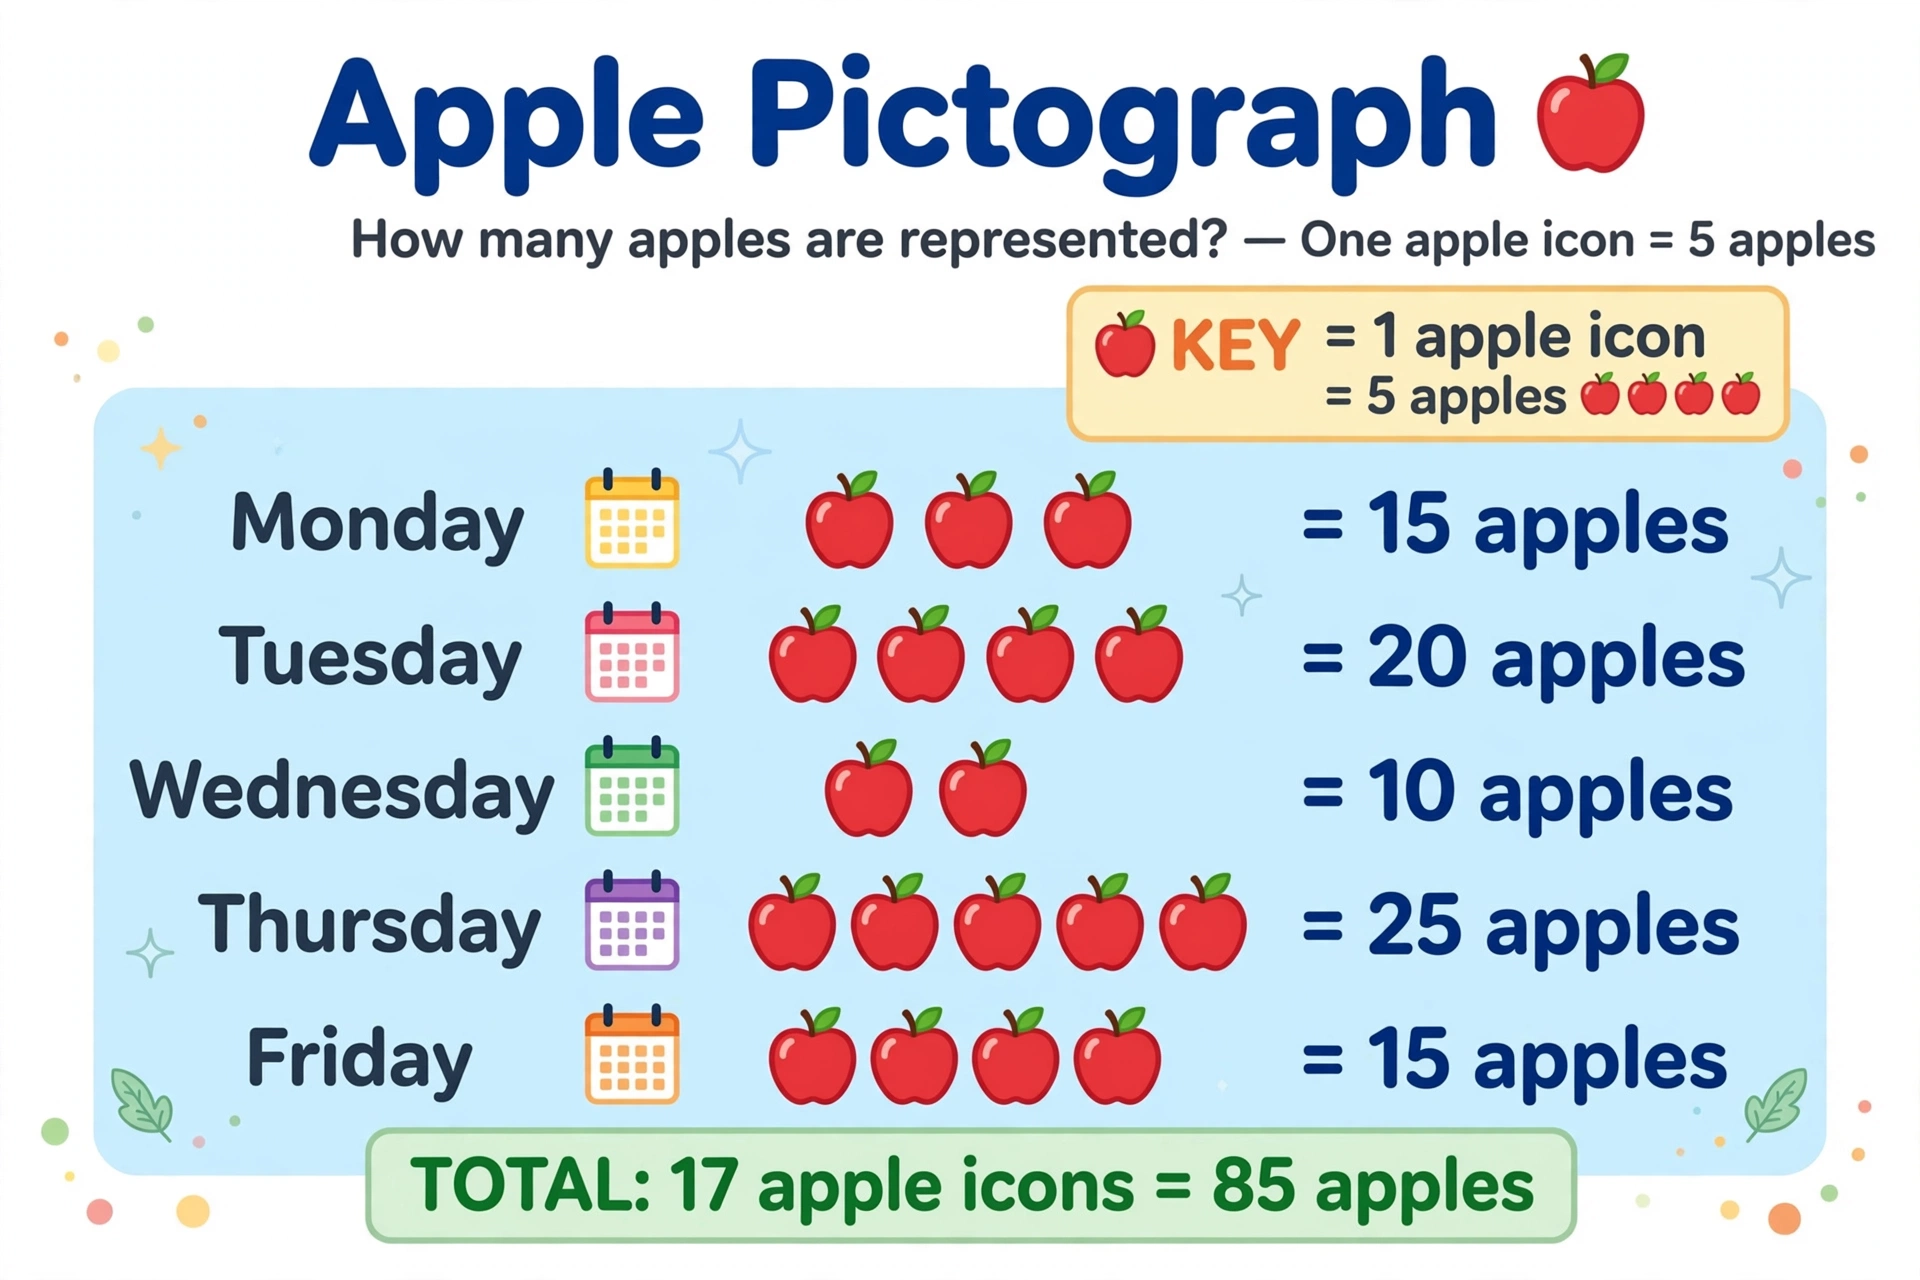
Look at a pictograph with apple icons. There are 4 apples in the “Red” row. Does that mean 4 apples? Not if the key says each apple icon equals 5 real apples. Then it means 20. That little box, the key, changes everything.
What Is a Key on a Graph?
A key (or legend) on a graph explains what the symbols represent. In pictographs, one picture might stand for multiple items. The key tells you the value: “Each 🍎 = 5 apples.” Without the key, you cannot read the graph correctly.
Keys appear on many graph types. Maps use keys to explain colors and symbols. Bar graphs might use keys to distinguish categories. But the concept is clearest in pictographs, where the symbol-to-value relationship is explicit.
Why Do Keys Matter?
They prevent misreading. A student who ignores the key will count icons instead of values, getting the wrong answer. Teaching students to check the key first builds the habit of reading all graph components before interpreting data.
Keys also teach scaling. Understanding that one symbol can represent 5 or 10 items prepares students for scaled bar graphs and for the idea that representations can be proportional, not just one-to-one.
How Do You Teach Keys?
Start with 1-to-1 pictographs (each icon = 1 item). Students learn to read the graph structure. Then introduce the key: “Now each icon means 2.” Let them experience the shift. The same picture now means double.
Have students create their own keys. “Draw a pictograph of our class pets. Decide what each icon means.” Creating the key forces them to think about the symbol-value relationship from the inside.
Try It: Make Pictograph With Key
Step 1: Choose a topic: favorite fruits, pets, colors.
Step 2: Collect data from the class.
Step 3: Decide the key: “Each star = 2 students.”
Step 4: Draw the pictograph. Trade with a partner. Can they read yours using the key?
Quick Practice
Question: A pictograph shows 6 car icons. The key says each icon = 3 cars. How many cars total?
Answer: 6 × 3 = 18 cars. Multiply the icon count by the key value.
Frequently Asked Questions
What is the difference between a key and a legend?
They are the same thing. “Key” is common in elementary math. “Legend” is used in geography and advanced graphing. Both explain symbols.
When do students learn about keys?
Pictographs with keys typically appear in 1st-2nd grade. The concept is simple but crucial for accurate data reading.
Can half-icons be used?
Yes. If each icon = 4, a half-icon = 2. This introduces fractions in a natural context and tests whether students truly understand the key.