
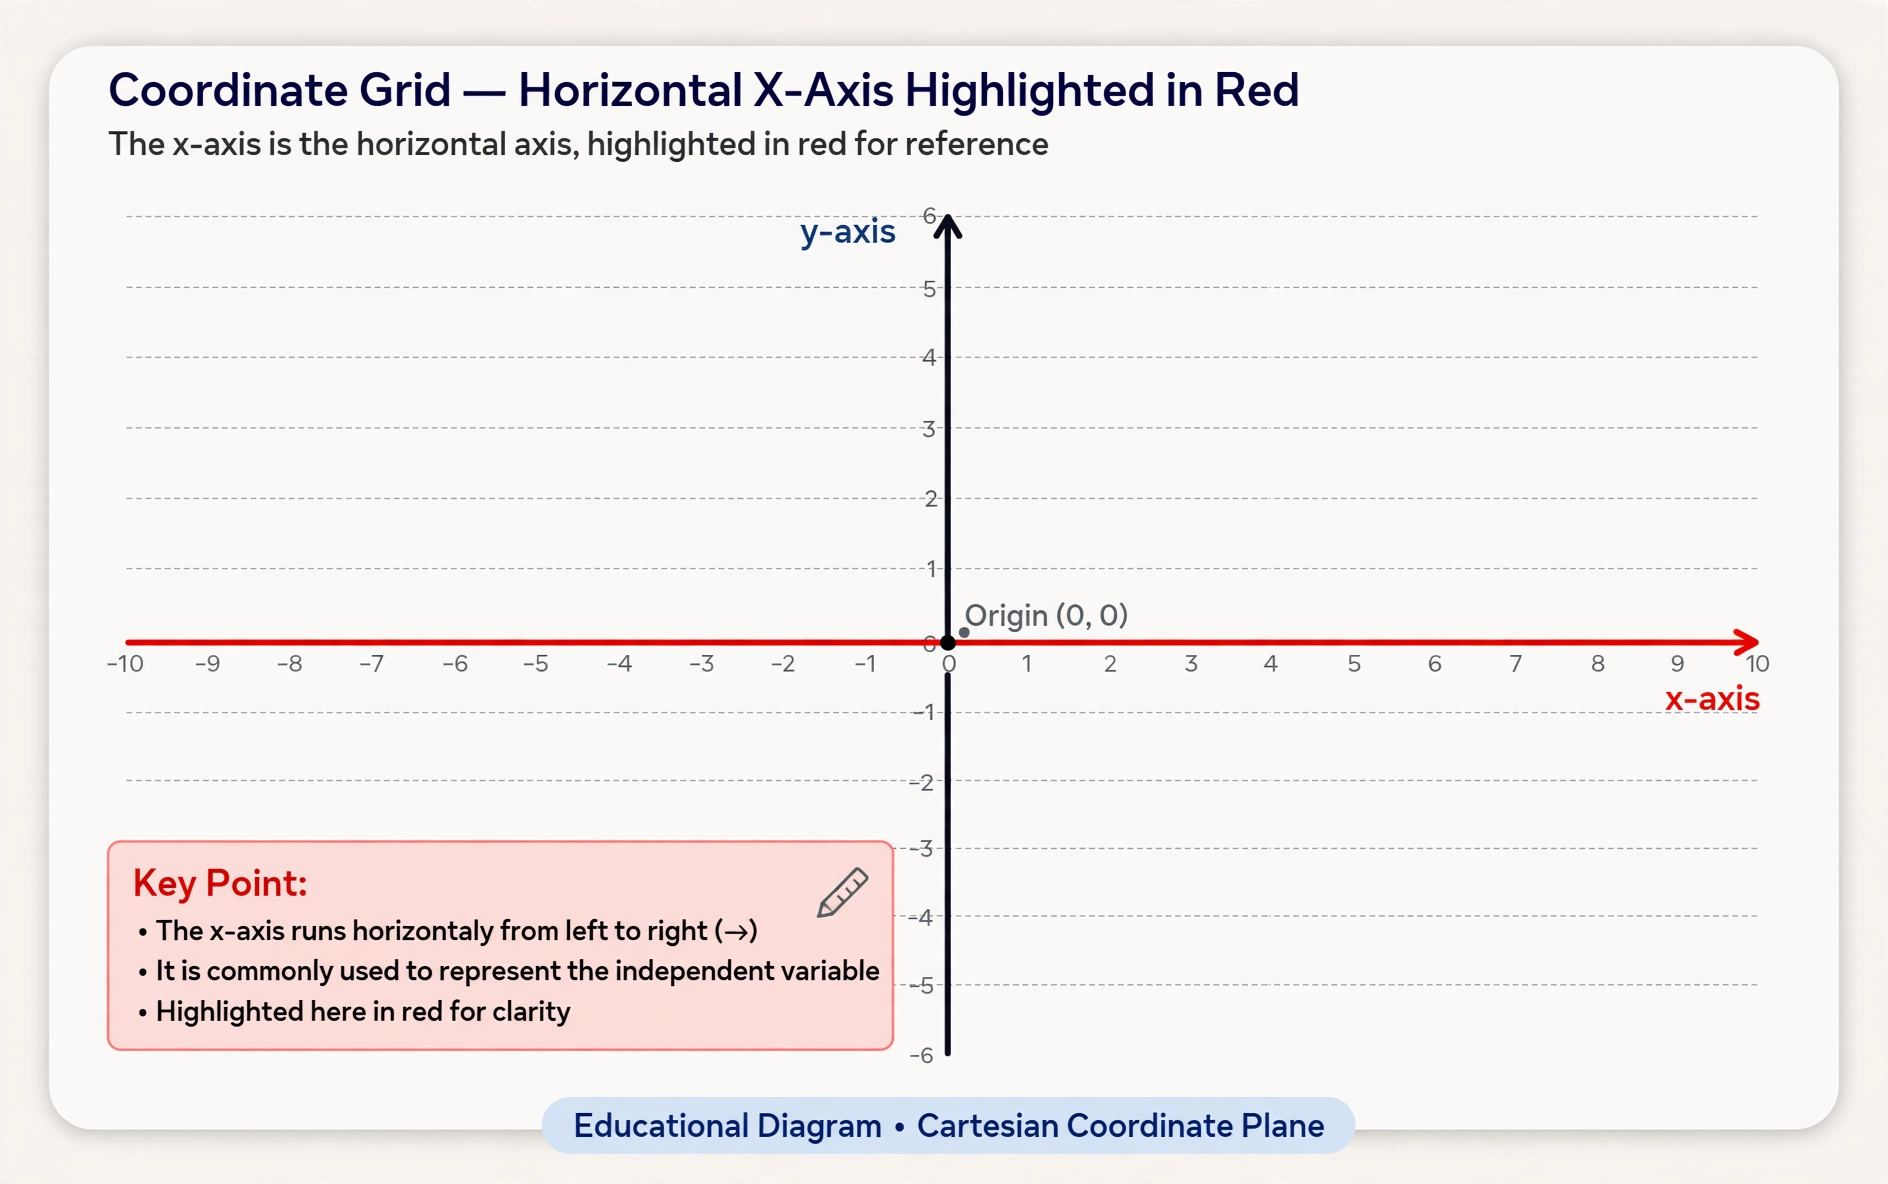
Draw a horizontal line. Mark numbers like a number line: 0 in the middle, positives to the right, negatives to the left. That is the x-axis, half of the coordinate system that lets us locate any point on a flat surface.
What Is the X-Axis?
The x-axis is the horizontal reference line on a coordinate grid. It runs left to right. Points are located by their x-coordinate (horizontal position) first, then y-coordinate (vertical). In the ordered pair (3, 4), 3 is the x-value: move 3 right from origin.
The x-axis divides the plane into top and bottom halves. Points above have positive y-values; below have negative. But the x-axis itself measures horizontal distance from the center.
How Do You Use It?
To plot (4, 2): start at origin (0,0). Move 4 units right along the x-axis. Then move 2 up. Mark the point. The x-coordinate always comes first in the pair, which helps remember: “across, then up” or “x before y” (alphabetical).
The x-axis also shows up in graphs of functions. Time is often on the x-axis (horizontal), with the measured quantity vertical. Reading left to right shows change over time.
Try It: Plot on X-Axis
Step 1: Draw a coordinate grid.
Step 2: Highlight the x-axis. Label -5 to 5.
Step 3: Plot (3, 0), (-2, 0), (0, 0). Notice they all sit on the x-axis because y=0.
Step 4: Plot (2, 3), (-4, 1). Move along x first, then up.
Quick Practice
Question: In the point (-5, 3), what is the x-coordinate? Which direction from origin?
Answer: x = -5. Move 5 units left from origin (negative x is left).
Frequently Asked Questions
Why is it called the x-axis?
Convention. René Descartes used x for the horizontal variable. The name stuck. Y is vertical, Z would be depth in 3D.
Can the x-axis be vertical?
No, by definition it is horizontal. If you rotate the paper, it is still the x-axis, just oriented differently. The math does not care about paper rotation.
What is the origin?
Where x-axis and y-axis cross: (0, 0). All positions are measured from here.