
Line Plots
Grade: 2-3 | Topic: Geometry | Badge: 🔒 MEMBERS ONLY
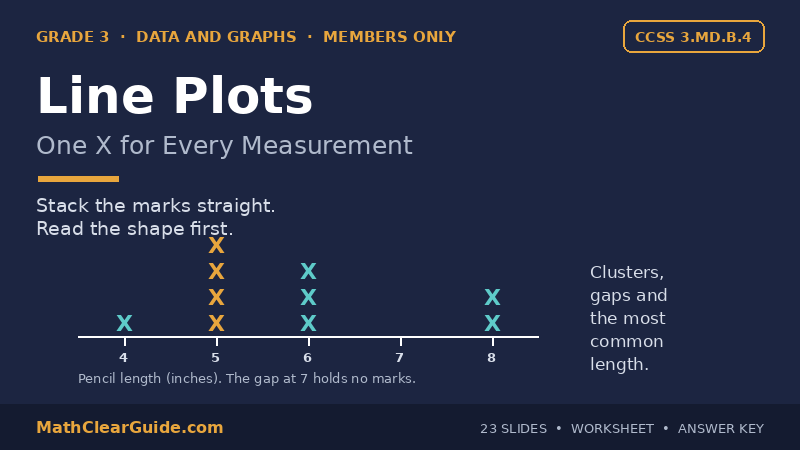
Grade 3 line plots lesson pack for CCSS 3.MD.B.4: 23 slides, a printable worksheet and a full answer key. Pupils build line plots from real measurement lists (pencil lengths, plant heights, long jumps, ribbon lengths) by placing one X for every measurement, then read the shape of each plot: where the marks cluster, where the gaps are, the most common value and the longest and shortest measurements. Includes cut-apart dot-plot task cards where pupils place the marks from a data list and describe the shape themselves. For grade 3 teachers and homeschoolers teaching the data and graphs unit, when pupils can measure in whole units and are ready to turn measurements into data.
Look Inside
