Data is information you collect by watching, asking, or measuring, then organize so it can answer a question.
What Is Data in Math?
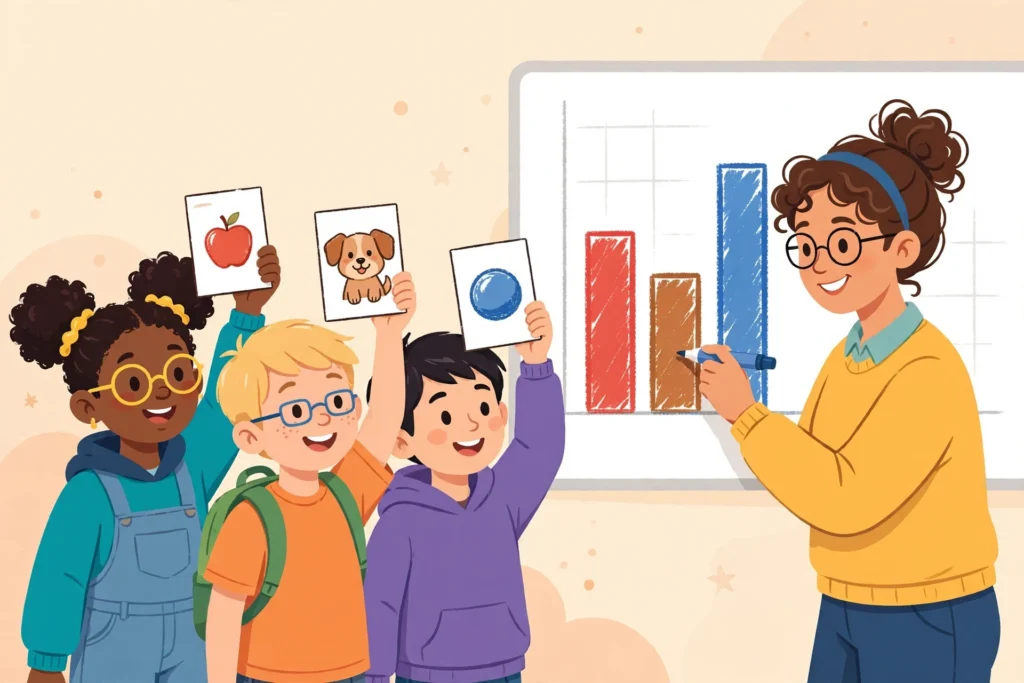
Imagine your teacher asks the class one question: which pet is your favorite, dog, cat, fish, or bird? Hands shoot up. Someone counts. The teacher writes dog: 12, cat: 8, fish: 5, bird: 3. That little table of answers is data.
Data is a collection of facts and numbers about something. It comes from three places: observation (watching what happens), questioning (asking people), and measurement (measuring something). Weather watchers record sunny or rainy days. Scientists measure how tall plants grow. You and your class count favorite pets. All of it is data.
Raw data is messy. A page of tally marks or a list of shouted answers is hard to read. The magic step is organizing it. When you sort data into a table or draw it as a graph, patterns pop out. Suddenly you can see that dogs won by a mile.
How Do You Collect Data?
Most classroom data starts with a survey question. A good survey question has answers you can sort into groups. “What is your favorite lunch?” works because every answer fits a category. “Why do you like lunch?” does not work as well, because the answers go everywhere.
Keep the question fair. Ask every student the same question the same way. Ask it once. If you ask your best friend three times and skip the quiet kid in the corner, your data is lopsided before you even start.
Record answers with tally marks. Four straight lines, then a diagonal line across to mark five. Tallies let you count fast without losing your place, and they bundle into fives that are easy to add later. One teacher I know calls them gate tallies, because the fifth mark closes the gate.
What Are Categorical Data and Numerical Data?
Data splits into two big families. Categorical data names a group or category: favorite color, type of pet, how you got to school today. You cannot do arithmetic on it. Adding “bus + walker” makes no sense.
Numerical data is numbers you can measure or count: how many books you read, how tall your plant grew, how many minutes you read last night. You can add it, compare it, and find patterns in it with real arithmetic.
In kindergarten through grade 5, most of the data students touch is categorical. Kindergarteners sort buttons by color. First graders organize those sorts into charts. By second grade, students draw picture graphs and bar graphs. Third graders stretch further, drawing picture graphs where one picture stands for more than one object. Each year the same idea grows: collect, organize, read.
How Do You Show Data?
A table is the first stop. Rows and columns hold the answers still while you think. But graphs do the talking.
| Graph | What it does | Best for |
| Picture graph | uses pictures or symbols, one per object or several per object | young students, favorite-things surveys |
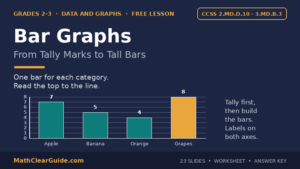
| Bar graph | uses bars, longer bars mean bigger numbers | comparing categories side by side |
| Line plot | uses X marks above a number line | measurement data, like lengths of leaves |
| Tally chart | bundles answers into groups of five | collecting data fast during a survey |
Picture graphs are the friendliest start. Each apple picture might stand for one student, or for two students in third grade when the numbers get bigger. The key, that little box that says what one picture stands for, matters more than anything. A graph without a key is a joke without a punchline.
Bar graphs make comparison instant. You do not need to read the numbers to see which bar is tallest. Line plots shine with measurement data. Measure ten leaves to the nearest centimeter, mark an X above each length on a number line, and the most common length stands up like a little tower of X’s.
Did You Know: Data Is Already Plural
Did You Know: the word data is the plural of datum, a Latin word that means something given. One fact is a datum. A pile of facts is data. That is why some grown-ups say “the data are clear” instead of “the data is clear.” Both sound fine in a classroom, but now you know the secret behind the word.
Try It: Survey Your Class

Hand one student a clipboard and make them the official data collector. Ask the class: “Which recess game is your favorite, tag, soccer, jump rope, or four square?” The collector draws four columns on chart paper and tallies each vote as it comes in.
Now build a bar graph together on the board. Let students argue about the scale. Should each square stand for one vote or two? Count the tallies twice, once by a student and once by the teacher, and watch how careful counting changes the totals.
Finish with three questions: Which game won? How many more votes did the winner get than last place? If one student changed their vote, might the winner change? Those three questions turn a fun vote into real data analysis.
Quick Practice
A picture graph shows favorite fruits. Each apple picture stands for 2 students. Apple: 5 pictures. Banana: 3 pictures. Orange: 4 pictures. How many students chose apple, and which fruit got the most votes?
Answer: 10 students chose apple, because 5 pictures times 2 students each equals 10. Banana got 3 times 2 = 6 votes. Orange got 4 times 2 = 8 votes. Apple won with 10 votes. Always multiply by what the key says, not by one.
Related Terms
Explore line plot and key (graphing).
Frequently Asked Questions
What is the difference between data and information?
Data is the raw material. Information is what you get after you organize data and read the story in it. A list of 24 tally marks is data. The sentence “most students ride the bus” is information that came from the data.
Can words be data?
Yes. Categorical data is often words: red, blue, dog, cat, bus, walker. Data does not have to be numbers. It has to be something you collected and can organize.
Which graph should I use for my data?
Use a picture graph or bar graph for categories, like favorite pets. Use a line plot for measurements, like the lengths of pencils. Match the graph to the kind of data you collected.
The next time someone asks your opinion, notice what happens. Your answer joins everyone else’s, and together those answers become data. You are a data source every single day.
Reading about it is one thing, practising it is another. Our free Tally Charts and Counting Data lesson builds the idea step by step, with slides, a printable worksheet and a full answer key.
Members unlock every lesson in the library, including the full Fractions, Multiplication, Place Value, Addition & Subtraction, Time & Money and Geometry & Shapes units. See the full library