A picture graph is a graph that uses pictures or symbols to show data. Each picture stands for a certain number of items, and a key explains what each picture is worth.
What Are the Parts of a Picture Graph?
Every picture graph has three parts working together. The title sits at the top and tells you what the graph is about, like Our Favorite Fruits or Books Read This Month. Without a title, the graph is just a pile of pictures with no story.
The pictures come next, lined up in rows or columns for each category. In a graph about favorite fruits, you might see a row of apple pictures, a row of banana pictures, and a row of orange pictures. The longer the row, the more votes that fruit earned. Your eyes can compare the rows in a glance, which is the whole point of a graph.
The third part is the key, and it is the most important one. The key tells you how many items each picture stands for. Sometimes each picture stands for 1, which is simple. Sometimes each picture stands for 2, 5, or even 10, which lets a small graph show big numbers. Always read the key before you read the pictures, or the numbers will come out wrong.
How Do You Read a Picture Graph?
Reading a picture graph is a three-step job. Step one: read the title so you know what you are looking at. Step two: read the key so you know what each picture is worth. Step three: count the pictures in a row and multiply by the key.
Common Mistake: Students count the pictures and stop there, forgetting the key. If each star stands for 2 books and a row shows 5 stars, the answer is not 5 books. It is 5 groups of 2, which is 10 books. The key is the rulebook of the graph, and skipping it is the fastest way to get the wrong number.
Picture graphs also answer comparison questions fast. Which row is longest? That category wins. How many more apples than bananas? Subtract the banana total from the apple total. Once the key is locked in your mind, the graph turns into a set of quick number puzzles waiting to be solved.
What Does the Key Tell You?
The key is a tiny box, usually at the bottom or side of the graph, that links pictures to numbers. It might show one apple picture next to the words stands for 2 students. That short line changes everything. It means you cannot just count pictures, you must count groups.
Keys let graph makers fit big data into small spaces. A class of 30 students does not need 30 pictures. With a key of one picture for every 2 students, 15 pictures do the job. Keys with larger numbers work the same way. If one car picture stands for 10 cars, then 3 car pictures show 30 cars sold in a month.
Sometimes a graph uses half a picture, and the key still rules. If one full ice cream picture stands for 2 cones sold, then half a picture stands for 1 cone. Half symbols are a favorite test question, so practice them. Draw a picture, cut it in half, and check what each half is worth before you answer.
How Is a Picture Graph Different from a Bar Graph?
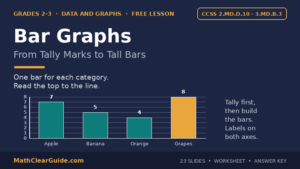
Picture graphs and bar graphs are cousins. Both show data, both have titles, and both make comparisons easy. The difference is what does the showing. A picture graph uses little pictures or symbols. A bar graph uses solid bars, and the height or length of each bar shows the amount.
Picture graphs shine with young learners because pictures are friendly and fun to draw. Bar graphs take over in later grades because bars handle exact numbers and large scales more cleanly. Many classes learn picture graphs first, then meet bar graphs as the next step. Knowing both gives students two tools for the same job: turning a pile of data into a picture that talks.
In class, I have students turn the same data into both graphs. We survey favorite pets, build the picture graph with paw print stamps, then rebuild it as a bar graph on graph paper. They notice the stories match but the looks differ. That side-by-side moment makes the relationship between the two graphs click in a way words alone never manage.
Try It: The Favorite Snack Graph

Start with a question the class cares about: Which snack should we have at our party? List four choices on the board, like apples, popcorn, crackers, and grapes. Each student gets one sticky note with a small picture of their pick and sticks it in the matching row on a big chart. In minutes, the class data stands on the wall in living color.
Now add the key. For the first round, keep it simple: each picture stands for 1 student. Count each row together and write the totals beside it. Which snack won? By how many votes? Let students argue it out using the graph as evidence. They are doing data analysis and loving it.
Round two is where the math deepens. Announce a new key: each picture now stands for 2 students. The same rows suddenly tell a bigger story, and students must multiply to find the new totals. A row of 8 pictures now means 16 students.
Quick Practice
Question: A picture graph shows favorite sports. The key says each ball picture stands for 2 students. The soccer row has 5 ball pictures. How many students chose soccer?
Worked answer: Each picture stands for 2 students, so 5 pictures stand for 5 groups of 2. Multiply: 5 times 2 equals 10. Ten students chose soccer.
Related Terms
- Key: the key is the rulebook of a picture graph, telling you what each picture stands for.
- Line Plot: a line plot is another way to show data, using X marks above a number line instead of pictures.
Frequently Asked Questions
What is another name for a picture graph?
A picture graph is also called a pictograph. Both names mean a graph that uses pictures to show data.
What does each picture stand for in a picture graph?
It depends on the key. Each picture can stand for 1 item or for a group of items like 2, 5, or 10. The key always tells you the value.
Why do picture graphs need a key?
Without a key, you cannot know whether one picture means 1, 5, or 100. The key turns pictures into real numbers so everyone reads the graph the same way.
Can a picture graph show half a picture?
Yes. A half picture stands for half the value of a full picture. If one full picture stands for 4, a half picture stands for 2.
When do students learn picture graphs?
Picture graphs usually appear in first through third grade. They are often the first type of graph students meet, before bar graphs and line plots.
Reading about it is one thing, practising it is another. Our free Picture Graphs lesson builds the idea step by step, with slides, a printable worksheet and a full answer key.
Members unlock every lesson in the library, including the full Fractions, Multiplication, Place Value, Addition & Subtraction, Time & Money and Geometry & Shapes units. See the full library